New Feature: Server summary page
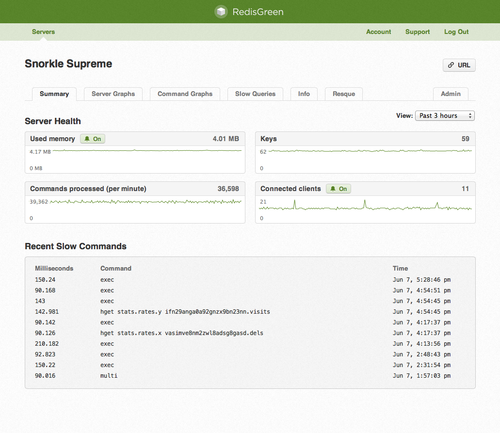
When helping RedisGreen customers improve their usage of Redis, we often search for the same few metrics to get an idea of what to investigate further. With this in mind, we revisited the design of the server summary dashboard to make it even easier to spot potential problems:
This new summary page is a distillation of two things: the most important server metrics and the most recent slowlog entries. Instead of searching for these bits of information on the full server graphs and slowlog tabs, you now have direct access to them right on the summary page.
The full set of server graphs can be found under the “Server Graphs” tab and, of course, the full set of command graphs live under the “Command Graphs” tab.
