New Feature: Command graphs
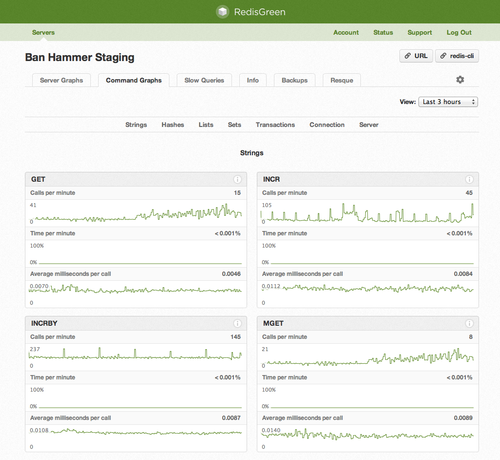
We added a major new feature for all RedisGreen users today: command graphs:

Command graphs track the performance and usage patterns for every single command that you run on your Redis server. Just like the existing server health graphs, we record these metrics every minute and store them for an entire year.
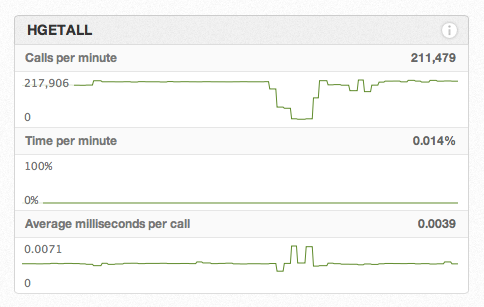
We graph three things for each command: the number of calls made every minute, the total amount of time per minute that is spent running that command, and the average runtime of that command:

In tandem with the existing server health graphs, these graphs give you deep insight into your usage of Redis and allow you to quickly diagnose performance problems before they become capital-P Problems.