Memetria Logo Memetria Changelog

We launched our new line of standardized X-Large instances today, supporting datasets of up to 60GB.

These new databases have all the benefits of our high-throughput extra large servers, plus extra RAM to hold even the largest datasets in memory. The new plans are available immediately, just select them when provisioning your new server. Upgrading to the larger plans is easy too.

As always, we offer custom plans for still larger instances. Drop us a line if you’re interested!

Exciting news today - we’ve added two new subscription plans to RedisGreen:

The “Mini Development” server is our cheapest server ever at just $14/mo. Like the “Development” server, it has shared resources. It’s a bit smaller than our standard Development servers, but good enough to work with daily on projects.

Our “Starter” server is the newest in our production line of servers, and the first time we’ve been able to price one of our production machines at less than $100. At $89/mo it’s a very good value and an excellent choice for startups and other low-cash businesses getting started with Redis. Like our Basic servers (and all other non-development servers), this one is highly performant and can handle significant production loads!

RedisMonitor is now open to all!

RedisMonitor is our battle-tested Redis monitoring service that has powered RedisGreen for the past several years. And now, we’re opening it up for anyone with a Redis server to use. For free. (Really!)

Go try it out now!

We’ve made some improvements to our new server provisioning process that reduces the time it takes for new servers to be created by up to 50%.

Most new RedisGreen servers are ready to be used instantly. For plans that we don’t have pre-provisioned servers ready to go, this will reduce the time spent waiting for the server to be ready for use.

The RedisGreen Resque dashboard now supports resque-scheduler. You can use the “Schedule” tab in the Resque dashboard to view recurring jobs, manually schedule jobs, and view currently queued delayed jobs.

RedisMonitors now supports Redis 2.4.0 and up. If you tried to create a RedisMonitor recently but couldn’t because you’re using Redis 2.4 or 2.5, you should now be able to.

Keep in mind that RedisMonitor is still in beta. If you run into any problems or would like to see any specific features, send us an email and we’ll help you out.

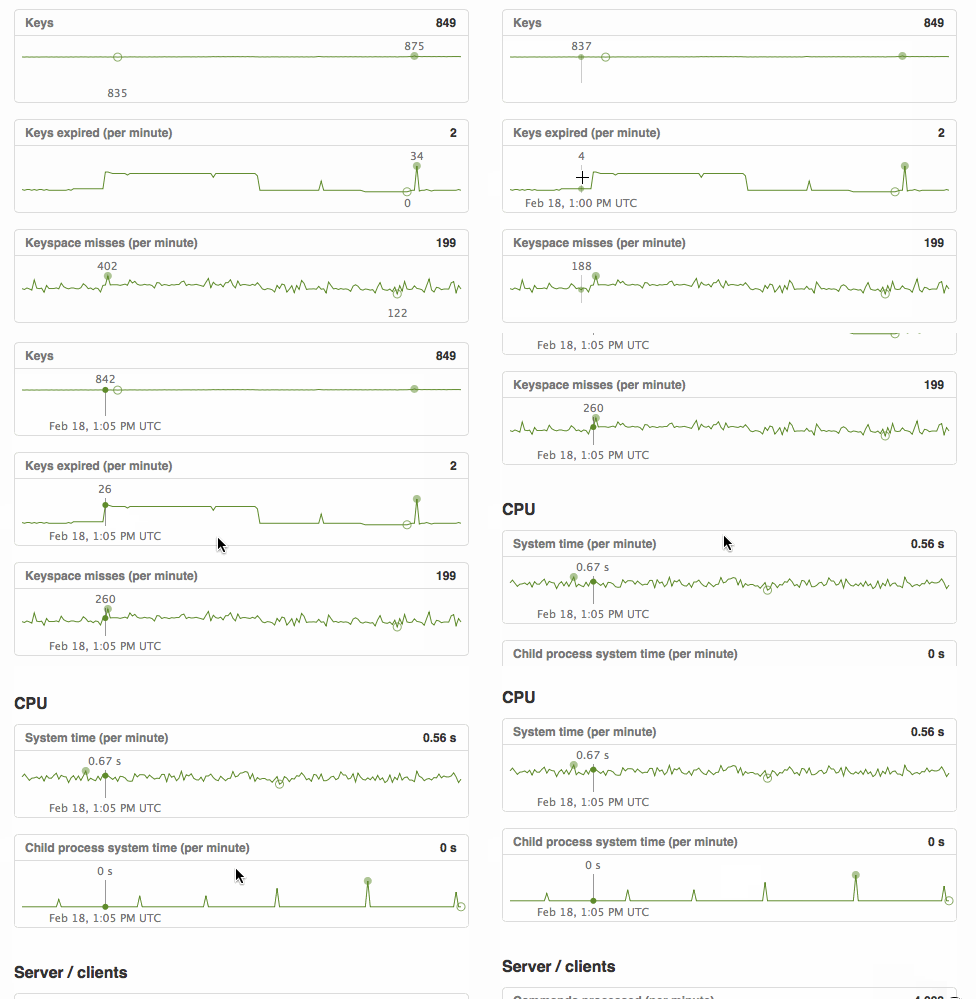
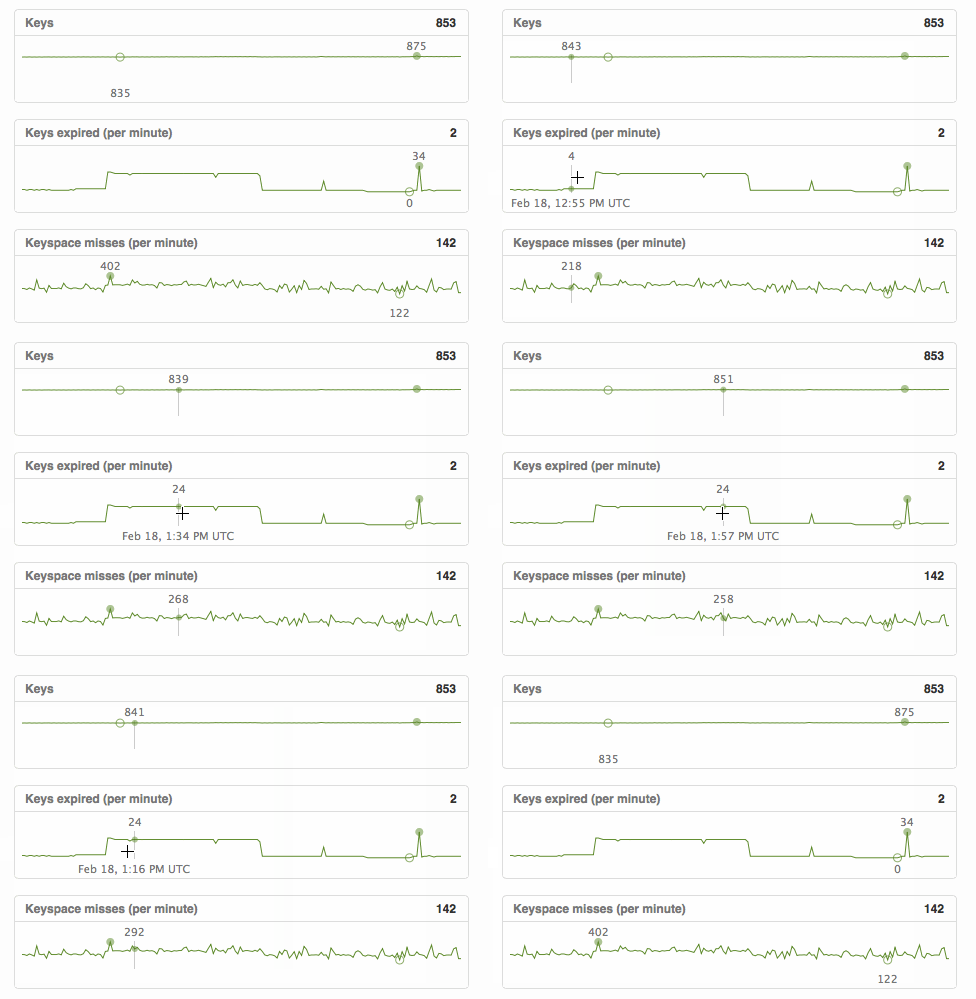
RedisGreen’s dashboard graphs have always been one of our most useful tools for monitoring and improving the performance of Redis. Today, we’ve made them even more useful with the addition of several great features.

First, all graphs now highlight their minimum and maximum values. This makes it easy to visualize the range of values displayed and to spot potential problem points.

To make correlation between graphs easy, graphs now display a marker below your cursor when you hover over them. This marker displays the value and timestamp for that point on all graphs.

You can also click on graphs to “pin” a marker at that point. When you pin a marker, the graphs will pause and allow you to scroll through all graphs to view the values at that point on all graphs.

We hope you find these new features as useful as we already have! If you have ideas on how we can make graphs even more powerful, send us an email.

We just completed a small number of performance improvements for the RedisGreen dashboard. Your pages should now load even faster than before!