Memetria Logo Memetria Changelog

The built-in Resque dashboard link now opens the dashboard in a new window:

Previously, the Resque dashboard sat inside an iframe in the RedisGreen dashboard. However, the default cookie security policies on many browsers (such as Safari and Internet Explorer) would prevent cookies from being saved, which would in turn cause the Resque dashboard to forget who you are and what server you were looking at.

The RedisGreen monitoring system has always meticulously tracked and recorded the performance of our Redis servers in our comprehensive set of graphs. It has also always tracked the ability of servers to receive new connections and keep them open. Today, we’re launching a new feature that exposes this information to you on all RedisGreen graphs:
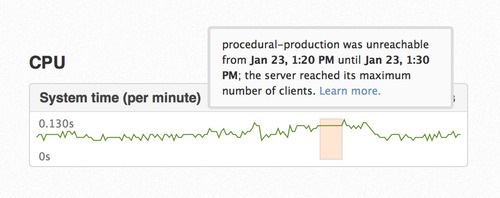
All RedisGreen graphs now display periods of time when our monitoring system detects problems with your server’s ability to accept new connections. You can click on these orange sections to learn more about the problem; when it started, when it ended, and what the underlying problem was.

There are many reasons why a server can be unreachable, and not all of them are fatal. This new information will help you catch, diagnose, and solve problems early. We’ve also created a page that explains the various reasons that a server can have difficulty receiving new connections.

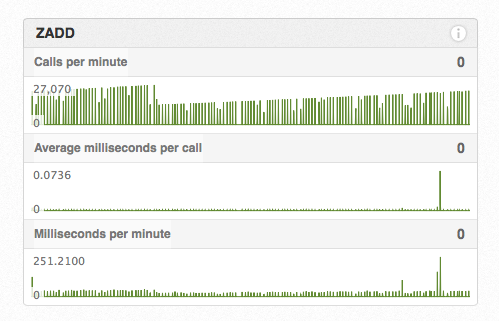
We have replaced the “Time per minute” graphs under the “Command Graphs” tab with “Milliseconds per minute” graphs. This graph is similar, except it shows the absolute number of milliseconds spent running each command every minute rather than the percentage of each minute spent running each command.

Over time, we’ve found that the total number of milliseconds spent per minute running each command is a much easier way to visualize the relative usage and performance of each command that you run, rather than just displaying a flat line and “< 0.001%” all the time.

Could we make the graphs more useful? Send us an email!

We’ve upgraded the Resque tab to use Resque 1.25.1. This, of course, does not affect your Resque clients or workers — just the Resque dashboard. We’ve also made some improvements to the Redis connection reliability of the Resque web interface.

Server backup lists are now significantly faster. Thanks to some infrastructure changes, they now load instantly rather than taking several seconds.

Over the next week, we’ll be rolling out gzipped backups to all RedisGreen servers. You may notice significant reductions in your backup file sizes, which will make backup downloads and restores much faster. This change only affects new backups — old backups will remain un-gzipped.

RedisGreen can now send alerts to a custom email address. This is especially useful if you want to trigger PagerDuty alerts when you reach 90% of your maximum memory or connected clients. You can set this email address on the Account page of the RedisGreen dashboard. By default, all alerts will be sent to your primary account email address.

You can now use a separate email address for invoices. Just look inside the “Account” tab on the RedisGreen dashboard.

Redis 2.6.14 has proven stable for a while now, so it is now the default version for all RedisGreen servers.

As always, if you would like your server to run a different version, we’re happy to set that up - just contact support!

RedisGreen is singularly focused on production-quality Redis. However, we’ve heard from many of our users that they’d also like to use RedisGreen for low-traffic development and testing projects that don’t require the robustness (and price) of our larger servers.

With that in mind, we’re launching our new “Development” servers today, for only $34 per month. These servers are perfect for development, testing, or other low-traffic purposes. Development servers come with all the same dashboard features as our biggest servers: server health graphs, per-command performance graphs, master-slave setups, and a built-in Resque dashboard. Development servers are backed up daily.

Interested? Try our new Development servers now!